CHN-DEMOGRAPHY-SYNOPSIS-7-PHC
📊 DEMOGRAPHY & DEMOGRAPHIC CYCLE
🔰 What is Demography?
🔹 Demography is the statistical and scientific study of human populations.
🔹 It focuses on size, structure, distribution, growth, and changes (birth, death, migration).
🔹 The word is derived from Greek:
🔸 Demos = People
🔸 Graphy = Study/Writing
📚 Scope of Demography
- Fertility (birth rate)
- Mortality (death rate)
- Migration (inflow & outflow)
- Population composition (age, sex, literacy)
- Population policies & health planning
🇮🇳 Sources of Demographic Data in India
| 📘 Source | 🔍 Purpose |
|---|---|
| Census (every 10 years) | Complete population count |
| Sample Registration System (SRS) | Birth/death rate data |
| National Family Health Survey (NFHS) | Fertility, health, nutrition, family welfare |
| Civil Registration System (CRS) | Official recording of births/deaths |
🔄 Stages of Demographic Cycle (5 Stages)
🧭 Also called Demographic Transition Model
| 🔢 Stage | 🔍 Description | 📉 Birth Rate | ⚰️ Death Rate | 📈 Population Growth | 🇮🇳 Indian Status |
|---|---|---|---|---|---|
| 1. High Stationary | High birth & death rate → little growth | High | High | Stable/slow | Pre-1920 |
| 2. Early Expanding | Death rate declines; birth rate remains high | High | ↓↓ Low | Rapid growth | 1920–1945 |
| 3. Late Expanding | Birth rate starts falling; death rate still low | ↓ Declining | Low | Slower growth | 1945–1980 (India) |
| 4. Low Stationary | Both birth & death rates low → stable population | Low | Low | Stable | Present Indian stage |
| 5. Declining | Birth rate < Death rate → population decline | Very low | Low | Negative growth | Future (e.g., Japan) |
🌍 India’s Demographic Status
📌 As of now, India is in Stage 4: Low Stationary Stage
🔹 Fertility rates declining (due to awareness & family planning)
🔹 Life expectancy increased (due to better healthcare)
🔹 Total Fertility Rate (TFR) approaching replacement level (~2.1)
🔹 Some Indian states (e.g., Kerala, Tamil Nadu) may soon enter Stage 5
🧠 Demographic Indicators in India (as per NFHS-5)
| 🧾 Indicator | 📍 India (2020–21) Approx. |
|---|---|
| Crude Birth Rate (CBR) | ~20.2 per 1000 population |
| Crude Death Rate (CDR) | ~6.0 per 1000 population |
| Infant Mortality Rate (IMR) | ~28 per 1000 live births |
| Total Fertility Rate (TFR) | ~2.0 children per woman |
| Life Expectancy | ~70 years |
| Sex Ratio (overall) | ~1020 females / 1000 males |
👩⚕️ Importance of Demography in Nursing
🔹 Helps in health needs assessment
🔹 Basis for population control & family welfare programs
🔹 Guides policy formulation and resource allocation
🔹 Useful for planning immunization, maternal-child health (MCH), and nutrition programs
🧠 Hot MCQs for Exams
✅ Q1. Which stage of demographic cycle is India currently in?
🅰️ Stage 4 – Low Stationary
✅ Q2. Which state in India has achieved replacement fertility?
🅰️ Kerala
✅ Q3. When was the last Census conducted in India?
🅰️ 2011 (Next was due in 2021 – postponed)
✅ Q4. What is the Total Fertility Rate in India?
🅰️ Around 2.0
✅ Q5. Which system provides continuous data on birth/death?
🅰️ SRS (Sample Registration System
🔄 Demographic Cycle (Demographic Transition Model)
🧠 Explained in a Descriptive Format with Indian Perspective
The Demographic Cycle, also known as the Demographic Transition Model, describes the historical shift in birth and death rates in a country as it develops economically and socially. It is divided into five distinct stages, each representing a pattern of population growth.
1️⃣ High Stationary Stage
In this initial stage, both birth rate and death rate are extremely high, often fluctuating due to famine, wars, and epidemics. The population growth is minimal or stagnant because the number of births is offset by an equally high number of deaths. There is no real medical advancement, and poor sanitation, nutrition, and healthcare are common.
🔹 Example in India: Before the year 1920, India was in this stage.
2️⃣ Early Expanding Stage
This stage is marked by a sharp decline in the death rate due to improvements in healthcare, sanitation, and nutrition. However, the birth rate remains high, leading to a population explosion. This is often observed in developing countries where access to modern medicine begins to improve but family planning awareness is still lacking.
🔹 Example in India: Between 1920 and 1945, India experienced rapid population growth due to declining death rates.
3️⃣ Late Expanding Stage
In the third stage, the birth rate starts to fall gradually as people gain access to education, family planning, and contraceptive methods. The death rate remains low, and although the population continues to grow, the rate of growth starts to slow down. Urbanization, female education, and socio-economic improvements play a major role.
🔹 Example in India: From 1945 to 1980, India entered this stage with visible reductions in fertility.
4️⃣ Low Stationary Stage
This is a stage where both birth rate and death rate are low and nearly equal, leading to a stable population size. The growth is very slow or even plateaued. Advanced healthcare, widespread education, gender equality, and smaller family norms become widespread in society.
🔹 Current Status of India: India is currently in this Low Stationary Stage, especially in urban and developed regions.
5️⃣ Declining Stage
In this final stage, the birth rate falls below the death rate, leading to a negative population growth or population decline. This is mostly seen in highly developed countries with aging populations and fewer births. Fertility rates are below the replacement level, and countries may face challenges related to a shrinking workforce and increased elderly dependency.
🔹 Example: Countries like Japan, Germany, and Italy are currently in this stage.
🔹 India’s Future: Some Indian states like Kerala and Tamil Nadu are gradually approaching this stage.
🌍 DEMOGRAPHIC TRENDS IN THE WORLD
🧠 Essential for Nursing Competitive Exams – NORCET, AIIMS, RRB, ESIC, NHM, NCLEX
🔰 Definition of Demographic Trends
Demographic trends refer to the changes in population characteristics over time, including population size, age distribution, birth & death rates, migration, fertility, urbanization, etc.
📈 Major Global Demographic Trends
1️⃣ 🌎 Rapid Population Growth in Developing Countries
✔️ Most population increase is occurring in Africa, Asia, and parts of Latin America
✔️ Countries like Nigeria, India, Pakistan, Ethiopia are seeing high fertility and youthful populations
2️⃣ 🧓 Population Ageing in Developed Countries
✔️ Low birth rates and high life expectancy → rising elderly population
✔️ Notable in Japan, Germany, Italy, Sweden, USA
✔️ Leads to increased demand for geriatric care and pension systems
3️⃣ 👨👩👧👦 Declining Fertility Rates
✔️ Global Total Fertility Rate (TFR) is falling
✔️ Causes: Women’s education, urbanization, contraceptive use
✔️ Many countries are below replacement level (TFR < 2.1)
🔸 Example: South Korea – TFR < 1
4️⃣ 🏙️ Urbanization
✔️ Over 55% of global population now lives in urban areas
✔️ Mega-cities growing rapidly – e.g., Delhi, Lagos, Jakarta, Mexico City
✔️ Challenges: Slums, sanitation, traffic, air pollution
5️⃣ 🚶♂️ Increased Migration (Voluntary & Forced)
✔️ Millions migrate for economic opportunities, conflict, or climate change
✔️ Refugee populations growing due to wars (Syria, Sudan, Ukraine)
✔️ Creates pressure on health & infrastructure in host countries
6️⃣ 🧬 Improved Life Expectancy
✔️ Due to better nutrition, healthcare, hygiene, vaccination
✔️ Global average life expectancy is now around 72–73 years
✔️ Highest: Japan (~85 years)
✔️ Lowest: Sub-Saharan Africa (~60 years)
7️⃣ 📉 Decline in Mortality Rates
✔️ Infant Mortality Rate (IMR) and Maternal Mortality Rate (MMR) have dropped
✔️ Major achievements through vaccination, skilled birth attendance, sanitation
🌐 Global Demographic Groups – Examples
| 🌍 Region | 🔢 TFR | 👵 Ageing | 🌆 Urban Pop. % | ⏳ Life Expectancy |
|---|---|---|---|---|
| Sub-Saharan Africa | 4.5–5.0 | Low | ~40% | ~60–65 years |
| South Asia (India) | ~2.0 | Moderate | ~35% | ~70 years |
| Europe | ~1.5 | High | ~75%+ | ~78–83 years |
| USA/Canada | ~1.6–1.9 | High | ~80% | ~78–82 years |
| Japan | ~1.3 | Very High | ~92% | ~84–85 years |
🧠 Key Global Demographic Terms
| 📘 Term | 📌 Meaning |
|---|---|
| TFR | Total Fertility Rate (avg. no. of children/woman) |
| IMR | Infant Mortality Rate (deaths <1 year/1000 births) |
| MMR | Maternal Mortality Rate |
| Dependency Ratio | Ratio of non-working (0–14 & 65+) to working pop. |
| Population Momentum | Population keeps growing even with falling TFR |
📌 MCQ Time – Quick Revision
✅ Q1. Which country has the highest proportion of elderly population?
🅰️ Japan
✅ Q2. Global average life expectancy is —
🅰️ ~72–73 years
✅ Q3. Which region has the highest TFR?
🅰️ Sub-Saharan Africa
✅ Q4. Urbanization is highest in —
🅰️ Developed countries (Europe, Japan, USA)
✅ Q5. Which demographic trend is seen in South Korea?
🅰️ Lowest fertility rate in the world
🎯 Summary:
🧬 World is transitioning toward:
- Lower fertility
- Longer life
- Smaller families
- More elderly
- Higher urban populations
- Greater migration challenges
🇮🇳📊 DEMOGRAPHIC TRENDS IN INDIA
🧠 Essential for Nursing Competitive Exams – NORCET, AIIMS, NHM, RRB, ESIC, NCLEX
🔰 What Are Demographic Trends?
🔹 Demographic trends refer to the changes and patterns in population structure over time, including growth rate, fertility, mortality, literacy, migration, and urbanization.
🔹 In India, these trends shape health policy, family welfare programs, education, and employment planning.
🇮🇳 Key Demographic Trends in India (Post-Independence to Present)
1️⃣ 📈 Declining Birth Rate (CBR)
🔸 1951 – ~40 per 1000
🔸 2023 – ~19.5 per 1000
✅ Due to: Family planning, education, urbanization, contraception access
2️⃣ ⚰️ Declining Death Rate (CDR)
🔸 1951 – ~25 per 1000
🔸 2023 – ~6.0 per 1000
✅ Due to: Better healthcare, vaccination, nutrition, sanitation
3️⃣ 🧒 Declining Total Fertility Rate (TFR)
🔸 1951 – 6.0 children/woman
🔸 2023 – 2.0 (Almost at replacement level)
✅ Indicates population stabilization
4️⃣ 🧓 Rising Life Expectancy
🔸 1951 – 37 years
🔸 2023 – ~70 years
✅ Due to improved medical facilities and living standards
5️⃣ 🧮 Population Growth Rate
🔸 Still increasing but slowing down
🔸 Annual growth rate now ~1%
🔸 India is the most populous country in the world (2023) – ~142 crore+
6️⃣ 🧠 Increasing Literacy Rate
🔸 1951 – 18%
🔸 2023 – ~77.7%
🔸 Male: ~84% | Female: ~71%
✅ Leads to lower fertility and better health indicators
7️⃣ 🏙️ Rapid Urbanization
🔸 Urban population:
▪️ 1951 – ~17%
▪️ 2023 – ~35–38%
✅ Challenges: Housing, sanitation, pollution, slums
8️⃣ 👩⚕️ Changing Sex Ratio
🔸 Overall (2023) – ~1020 females per 1000 males
🔸 Improved due to awareness, legal interventions (PCPNDT Act)
9️⃣ 👨👩👧👦 Youth Bulge
🔸 India has a young population
🔸 Over 65% below 35 years
🔸 Median age: ~28 years
✅ Demographic dividend if skilled properly
🔟 🚶♂️ Internal Migration Trends
🔹 People migrating from rural to urban areas for jobs
🔹 Rising number of inter-state migrants (UP, Bihar → Maharashtra, Delhi)
📊 Current Key Indicators (NFHS-5 & SRS Data)
| 🧾 Indicator | 📍 India (2021–23 approx.) |
|---|---|
| Population | ~142 crore (1.42 billion) |
| CBR (Crude Birth Rate) | ~19.5/1000 |
| CDR (Crude Death Rate) | ~6.0/1000 |
| TFR | ~2.0 children/woman |
| IMR (Infant Mortality) | ~28/1000 live births |
| MMR (Maternal Mortality) | ~97/100,000 live births |
| Life Expectancy | ~70 years |
| Sex Ratio (overall) | ~1020 females per 1000 males |
🇮🇳 India’s Demographic Stage
🔸 India is currently in the 4th stage of the Demographic Cycle – Low Stationary
✅ Birth and death rates low
✅ Population growth stabilizing
✅ Health indicators improving
👩⚕️ Importance for Nurses & Health Planners
✔️ Helps in policy planning & resource allocation
✔️ Guides maternal-child health, family planning, immunization programs
✔️ Tracks trends for epidemiology & prevention
🧠 High-Yield MCQs
✅ Q: What is India’s current stage in the demographic cycle?
🅰️ Stage 4 – Low Stationary
✅ Q: What is India’s TFR in 2023?
🅰️ ~2.0 children per woman
✅ Q: Which state has the highest literacy rate?
🅰️ Kerala
✅ Q: Which indicator shows population aging?
🅰️ Increased life expectancy
✅ Q: What is the sex ratio of India in 2023?
🅰️ ~1020 females per 1000 males
💥👨👩👧👦 POPULATION EXPLOSION: CAUSES & IMPACT
🔰 What is Population Explosion?
🔹 Population explosion refers to a sudden and rapid increase in population, beyond the carrying capacity of a country or region.
🔹 It leads to imbalanced resources, increased burden on healthcare, education, housing, and environment.
🧨 Causes of Population Explosion
1️⃣ 📉 Decline in Death Rate
- Better medical facilities
- Immunization & antibiotics
- Improved sanitation and hygiene
2️⃣ 📈 High Birth Rate
- Cultural preference for more children
- Early marriage
- Lack of awareness about family planning
3️⃣ 🚼 Low Use of Contraceptives
- Myths and misconceptions
- Inaccessibility in rural areas
- Gender inequality in decision-making
4️⃣ 🧠 Illiteracy & Low Female Education
- Less reproductive awareness
- Less empowerment of women
5️⃣ 🧘♂️ Religious & Social Beliefs
- Some communities oppose contraception
- Children seen as economic assets
6️⃣ 🌾 Agrarian Economy
- More children = more working hands in rural/agricultural areas
7️⃣ 🏥 Improved Health Services
- Decreased infant mortality (more children surviving to adulthood)
🌍 Impacts of Population Explosion
🔸 Social Impacts
✔️ Overcrowding in cities
✔️ Increased slums, homelessness
✔️ Unemployment and poverty
✔️ Increased crime and social unrest
🔸 Economic Impacts
✔️ Pressure on jobs, education, food supply
✔️ Increased dependency ratio
✔️ Lower per capita income
✔️ Strain on public health & welfare systems
🔸 Health Impacts
✔️ Malnutrition and communicable diseases
✔️ Overburdened hospitals
✔️ Inadequate maternal-child health services
🔸 Environmental Impacts
✔️ Deforestation and pollution
✔️ Water scarcity
✔️ Waste management crisis
✔️ Climate change acceleration
🔸 Education & Housing Impact
✔️ Lack of infrastructure
✔️ Poor quality of education
✔️ Overcrowded classrooms and housing units
🧠 Hot MCQs for Revision
✅ Q1. Main cause of population explosion in India?
🅰️ Decline in death rate
✅ Q2. Overpopulation leads to which of the following?
🅰️ Unemployment and malnutrition
✅ Q3. Population explosion results in—
🅰️ Increased burden on healthcare system
✅ Q4. Which factor contributes to high birth rate?
🅰️ Illiteracy and early marriage
✅ Q5. Which sector is most affected by population explosion?
🅰️ Health, education, environment, economy – all of these
💡 Summary:
🚨 Population explosion = Imbalance between population size and resources
👉 Caused by falling death rate, high birth rate, low contraception use
⚠️ Impacts economy, health, environment, and overall development
👨👩👧👦 POPULATION POLICY
🧠 Perfect for Nursing Competitive Exams – NORCET, AIIMS, RRB, NHM, ESIC, NCLEX
🔰 Definition
🔹 A Population Policy is a strategic plan or guideline implemented by the government to control population growth and promote sustainable development, while ensuring better health, welfare, and quality of life for citizens.
🎯 Objectives of Population Policy
✔️ To reduce birth rate and fertility rate
✔️ To stabilize population growth
✔️ To promote maternal and child health
✔️ To ensure universal access to contraception
✔️ To encourage delayed marriage and small family norm
✔️ To enhance literacy, especially female literacy
📜 Evolution of Population Policy in India
| 📆 Year | 🏛️ Milestone |
|---|---|
| 1952 | India became the first country to adopt a population policy |
| 1976 | Population control added to National Health Policy |
| 1977 | Voluntary population policy with incentives, education |
| 2000 | Launch of National Population Policy (NPP) 2000 |
| 2021 | Draft population control bills introduced in some states (e.g., Uttar Pradesh, Assam – not yet law nationwide) |
📘 National Population Policy (NPP) 2000 – Key Points
🎯 Immediate Goals:
✔️ Address unmet needs for contraception
✔️ Strengthen healthcare infrastructure
✔️ Improve delivery of reproductive & child health services
🎯 Medium-Term Goals (by 2010):
✔️ Achieve TFR of 2.1 (replacement level)
✔️ Reduce IMR, MMR, and unmet contraceptive need
🎯 Long-Term Goals (by 2045):
✔️ Stabilize population consistent with sustainable development
🧩 Key Strategies under NPP 2000
🔹 Promote delayed marriage (girls ≥ 18, boys ≥ 21)
🔹 Compulsory education till age 14
🔹 Encourage male participation in family planning
🔹 Provide free and accessible contraception
🔹 Train health workers in reproductive & child health
🔹 Use of IEC (Information, Education, Communication) campaigns
🔹 Provide incentives for sterilization, spacing, and small families
🧠 Nursing Role in Population Control
👩⚕️ Nurses can:
✔️ Educate couples on family planning methods
✔️ Distribute contraceptives and condoms
✔️ Promote institutional deliveries
✔️ Identify and counsel high-risk families
✔️ Conduct IEC & behavior change communication (BCC)
✔️ Help reduce IMR/MMR through safe motherhood initiatives
📊 Key Indicators Linked to Population Policy
| 📌 Indicator | 📍 India (2023 approx.) |
|---|---|
| Total Fertility Rate (TFR) | ~2.0 children/woman |
| IMR | ~28 per 1000 live births |
| MMR | ~97 per 100,000 live births |
| Literacy Rate | ~77.7% overall |
🧠 MCQs – Quick Review
✅ Q1. When was India’s National Population Policy launched?
🅰️ 2000
✅ Q2. What is the goal TFR under NPP 2000?
🅰️ 2.1 (replacement level fertility)
✅ Q3. First country in the world to launch a national population policy?
🅰️ India (1952)
✅ Q4. One long-term goal of NPP 2000 is—
🅰️ Population stabilization by 2045
✅ Q5. Which policy promoted delayed marriage and small family norm?
🅰️ National Population Policy 2000
🌟 Summary
✅ Population policy = Strategy to manage population growth
✅ India’s population policy is based on voluntary & informed choices
✅ NPP 2000 is a landmark policy aiming for population stabilization by 2045
📊 DEMOGRAPHIC INDICATORS WITH EXAMPLES
🔰 What Are Demographic Indicators?
🔹 Demographic indicators are quantitative tools that help measure the population structure, dynamics, and health status of a country or region.
🔹 These are used by health planners and policymakers to assess development, track population changes, and design programs.
📘 Major Demographic Indicators – Explained with Examples
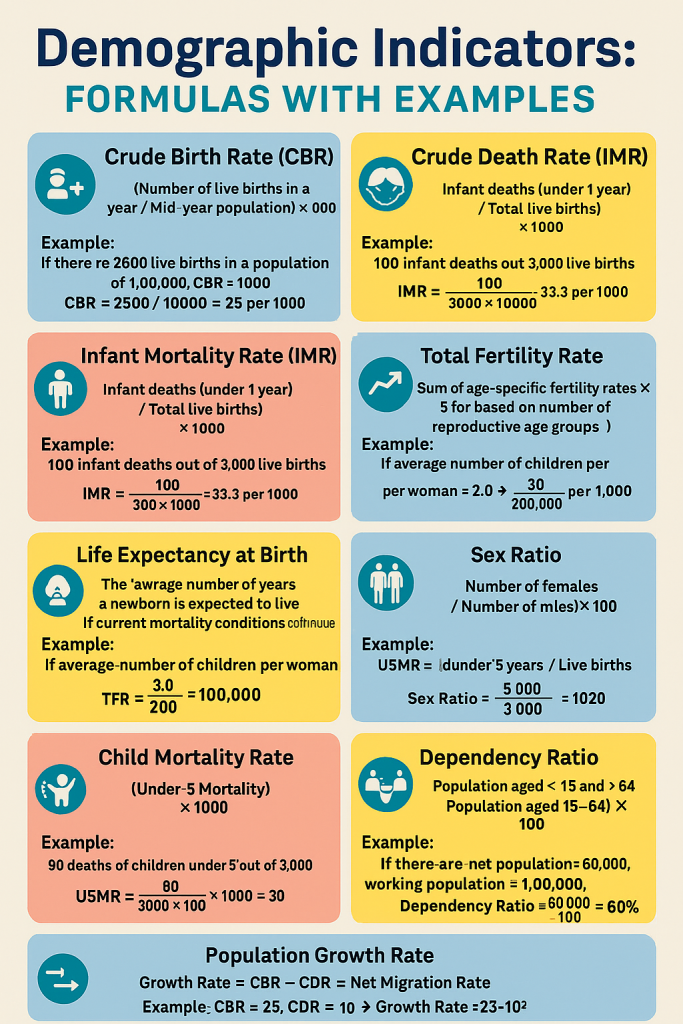
1️⃣ 📈 Crude Birth Rate (CBR)
🔸 Definition: Number of live births per 1,000 population in a given year
🔸 Formula:CBR = (Total live births / Mid-year population) × 1000
🔸 Example: India’s CBR ~ 19.5/1000 (2023)
2️⃣ ⚰️ Crude Death Rate (CDR)
🔸 Definition: Number of deaths per 1,000 population in a given year
🔸 Formula:CDR = (Total deaths / Mid-year population) × 1000
🔸 Example: India’s CDR ~ 6.0/1000
3️⃣ 👶 Infant Mortality Rate (IMR)
🔸 Definition: Number of infant deaths (<1 year) per 1,000 live births
🔸 Formula:IMR = (Infant deaths / Live births) × 1000
🔸 Example: India’s IMR ~ 28/1000 live births
4️⃣ 🤰 Maternal Mortality Ratio (MMR)
🔸 Definition: Number of maternal deaths per 100,000 live births
🔸 Formula:MMR = (Maternal deaths / Live births) × 100,000
🔸 Example: India’s MMR ~ 97/100,000 live births
5️⃣ 🧒 Total Fertility Rate (TFR)
🔸 Definition: Average number of children a woman would bear in her lifetime
🔸 Example: India’s TFR ~ 2.0 (2023)
✔️ Replacement level = 2.1
6️⃣ 👵 Life Expectancy at Birth
🔸 Definition: Average number of years a newborn is expected to live
🔸 Example: India’s Life Expectancy ~ 70 years
🔸 Developed countries: ~82–85 years
7️⃣ 👦 Sex Ratio
🔸 Definition: Number of females per 1,000 males in the population
🔸 Example: India’s sex ratio ~ 1020 females / 1000 males
8️⃣ 📚 Literacy Rate
🔸 Definition: % of people aged 7 years and above who can read and write
🔸 Example: India ~ 77.7% overall
🔹 Male: ~84% | Female: ~71%
9️⃣ 🏙️ Urbanization Rate
🔸 Definition: % of total population living in urban areas
🔸 Example: India ~ 35–38% urban population
🔟 🧮 Population Growth Rate
🔸 Definition: % increase in population in a year
🔸 Example: India ~ 1.0% annually (2023)
1️⃣1️⃣ 👶 Child Mortality Rate (CMR)
🔸 Definition: Deaths of children under 5 per 1,000 live births
🔸 Example: India ~ 32–35/1000
1️⃣2️⃣ 📉 Dependency Ratio
🔸 Definition: Ratio of dependents (<15 and >64 years) to working-age population
🔸 Formula:Dependency Ratio = (Population aged <15 + >64) / Population 15–64 × 100
🔸 Use: Indicates economic burden
🧠 Mnemonic to Remember Key Indicators:
💡 “B-D-I-M-T-L-S-L-U-G-C-D”
- Birth Rate
- Death Rate
- IMR
- MMR
- TFR
- Life Expectancy
- Sex Ratio
- Literacy
- Urbanization
- Growth Rate
- Child Mortality
- Dependency Ratio
📌 MCQ Quick Practice
✅ Q1. What is the current TFR in India?
🅰️ ~2.0 children/woman
✅ Q2. IMR measures deaths under what age?
🅰️ Below 1 year
✅ Q3. Sex ratio indicates—
🅰️ Females per 1000 males
✅ Q4. Literacy rate in India (approx)?
🅰️ ~77.7%
✅ Q5. What is the replacement fertility level?
🅰️ 2.1