chn-1-unit-8-Introduction toEpidemiology –EpidemiologicalApproaches andProcesses
🧪📊 Epidemiology: Definition and Concept
The Science Behind Disease Patterns and Public Health Actions
✅ 1. Definition of Epidemiology
Epidemiology is the study of the distribution and determinants of health-related events (such as diseases, injuries, and risk factors) in specific populations, and the application of this study to control health problems.
🔹 According to CDC (Centers for Disease Control and Prevention):
“Epidemiology is the method used to find the causes of health outcomes and diseases in populations.”
🔹 According to John M. Last (Dictionary of Epidemiology):
“Epidemiology is the study of the distribution and determinants of health-related states or events in specified populations, and the application of this study to the control of health problems.”
🔍 2. Key Concepts in Epidemiology
| Concept | Explanation |
|---|---|
| Distribution | Study of who, where, and when diseases occur (person, place, time) |
| Determinants | Factors that influence disease (e.g., biological, social, environmental) |
| Health-related Events | Includes communicable and non-communicable diseases, injuries, disabilities |
| Population Focus | Looks at groups of people, not just individuals |
| Application in Public Health | Using data to prevent disease, promote health, and guide policy |
🎯 3. Goals of Epidemiology
- Identify causes and risk factors of diseases
- Study patterns of disease occurrence and spread
- Evaluate effectiveness of health programs or interventions
- Provide evidence for planning and policy-making
- Prevent and control outbreaks and health problems
🩺 4. Importance of Epidemiology in Nursing and Public Health
| Application | Example |
|---|---|
| Outbreak investigation | Finding source and control of cholera or COVID-19 outbreak |
| Health surveillance | Monitoring TB, malaria, diabetes trends in a population |
| Program evaluation | Assessing impact of vaccination drives or maternal health programs |
| Policy development | Evidence-based health decisions (e.g., mask mandates, lockdowns) |
| Nursing research and planning | Designing community health interventions |
🧾
Epidemiology is the foundation of public health, helping us understand why diseases happen, who is at risk, and how to prevent or control them. For nurses and health workers, understanding epidemiology means being better equipped to protect and promote community health.
📊 Distribution and Frequency of Disease
Understanding How, Where, and Among Whom Diseases Occur
✅ 1. What Do We Mean by “Distribution” in Epidemiology?
Distribution refers to the patterns of disease occurrence across different groups, places, and times.
It helps answer:
- Who is affected?
- Where is the disease occurring?
- When is the disease occurring?
This helps public health professionals identify high-risk groups, predict outbreaks, and plan interventions.
🔍 2. Components of Disease Distribution
A. Person (Who is affected?)
Examines disease based on:
- Age (e.g., measles in children, heart disease in elderly)
- Sex (e.g., breast cancer in women, prostate cancer in men)
- Occupation (e.g., silicosis in miners)
- Lifestyle factors (smoking, alcohol, physical activity)
- Socioeconomic status (education, income, housing)
B. Place (Where is the disease occurring?)
Looks at geographic variations:
- Rural vs urban
- Region, state, or country level (e.g., malaria in tropical regions)
- Environmental factors (water source, sanitation, climate)
- Institutional settings (e.g., outbreaks in hospitals or schools)
C. Time (When is the disease occurring?)
Examines patterns over:
- Short-term (seasonal) – flu in winter
- Long-term (trends) – rise in diabetes over decades
- Epidemic outbreaks – sudden spike in dengue cases
📈 3. What is Disease Frequency?
Frequency refers to how often a disease occurs in a population and is measured using specific indicators.
📊 4. Measures of Disease Frequency
| Measure | Definition | Example |
|---|---|---|
| Incidence | Number of new cases of a disease in a specific time period | “There were 50 new cases of TB per 1,00,000 people in 2023” |
| Prevalence | Total number of existing cases (old + new) at a given time | “10% of adults currently have diabetes” |
| Morbidity Rate | Frequency of illness in a population | Used for disease burden calculations |
| Mortality Rate | Frequency of death due to a disease in a population | “Infant mortality rate is 28 per 1,000 live births” |
| Case Fatality Rate | % of people dying after getting the disease | High in Ebola, low in chickenpox |
🎯 5. Importance of Understanding Disease Distribution & Frequency
- Identify high-risk populations
- Guide resource allocation and interventions
- Detect outbreaks and epidemics early
- Evaluate effectiveness of public health programs
- Inform health policies and education strategies
🧾
Understanding the distribution and frequency of disease is key to epidemiology and community health nursing. It helps in identifying who is at risk, where to focus services, and how often diseases occur, enabling nurses and public health workers to prevent, control, and manage health problems effectively.
📌 Aims and Uses of Epidemiology
Guiding Prevention, Care, and Health Planning Through Scientific Study
🎯 Aims of Epidemiology
The primary aim of epidemiology is to:
Study the distribution and determinants of health and disease in populations, and apply that knowledge to control health problems.
✅ Key Aims Explained:
- Identify the Cause (Etiology) of Disease
- Understand risk factors and pathways of disease
- Example: Smoking causes lung cancer
- Determine the Extent of Disease in a Population
- Measure disease burden through prevalence, incidence, etc.
- Study the Natural History and Progression of Diseases
- Track how diseases develop and change over time
- Example: HIV → AIDS if untreated
- Evaluate Preventive and Therapeutic Measures
- Assess effectiveness of vaccines, treatment protocols, or screening programs
- Example: Polio cases reduced after vaccination campaigns
- Provide the Basis for Public Health Policy and Planning
- Use data to develop evidence-based policies, programs, and health interventions
- Example: National Tuberculosis Control Program (RNTCP)
📚 Uses of Epidemiology
| Use | Explanation |
|---|---|
| 1. Studying Disease Patterns | Understand who gets sick, where, when, and why (Person-Place-Time) |
| 2. Identifying Risk Factors | Determine habits or exposures leading to disease (e.g., smoking → cancer) |
| 3. Disease Surveillance and Monitoring | Track outbreaks and trends (e.g., COVID-19 case counts) |
| 4. Evaluating Health Programs | Test the impact of screening, vaccination, or treatment programs |
| 5. Planning and Resource Allocation | Helps governments decide where to spend for max health impact |
| 6. Setting Public Health Priorities | Focus attention on pressing issues (e.g., maternal mortality, HIV) |
| 7. Detecting Epidemics Early | Identify abnormal spikes in disease and initiate control measures |
| 8. Guiding Clinical Research | Provides direction for research trials and preventive strategies |
📌 Example in Practice
During the COVID-19 pandemic, epidemiology was used to:
- Track infection rates globally (distribution & frequency)
- Identify risk groups (elderly, immunocompromised)
- Guide quarantine, testing, and vaccination programs
- Evaluate vaccine effectiveness and control strategies
- Support health policy decisions (lockdowns, mask mandates)
🧾
Epidemiology is a powerful tool that helps nurses, doctors, and policymakers understand diseases, prevent outbreaks, plan resources, and save lives. Its aims and uses form the foundation of effective public health systems.
🧠 Epidemiological Models of Causation of Disease
Understanding How and Why Diseases Occur in Populations
✅ What is Causation in Epidemiology?
Causation refers to identifying what factors are responsible for the onset and spread of disease. In epidemiology, causal models help health professionals:
- Understand how diseases develop
- Plan preventive strategies
- Guide health interventions and research
📊 Major Models of Causation
1️⃣ Epidemiological Triad (Traditional Model)
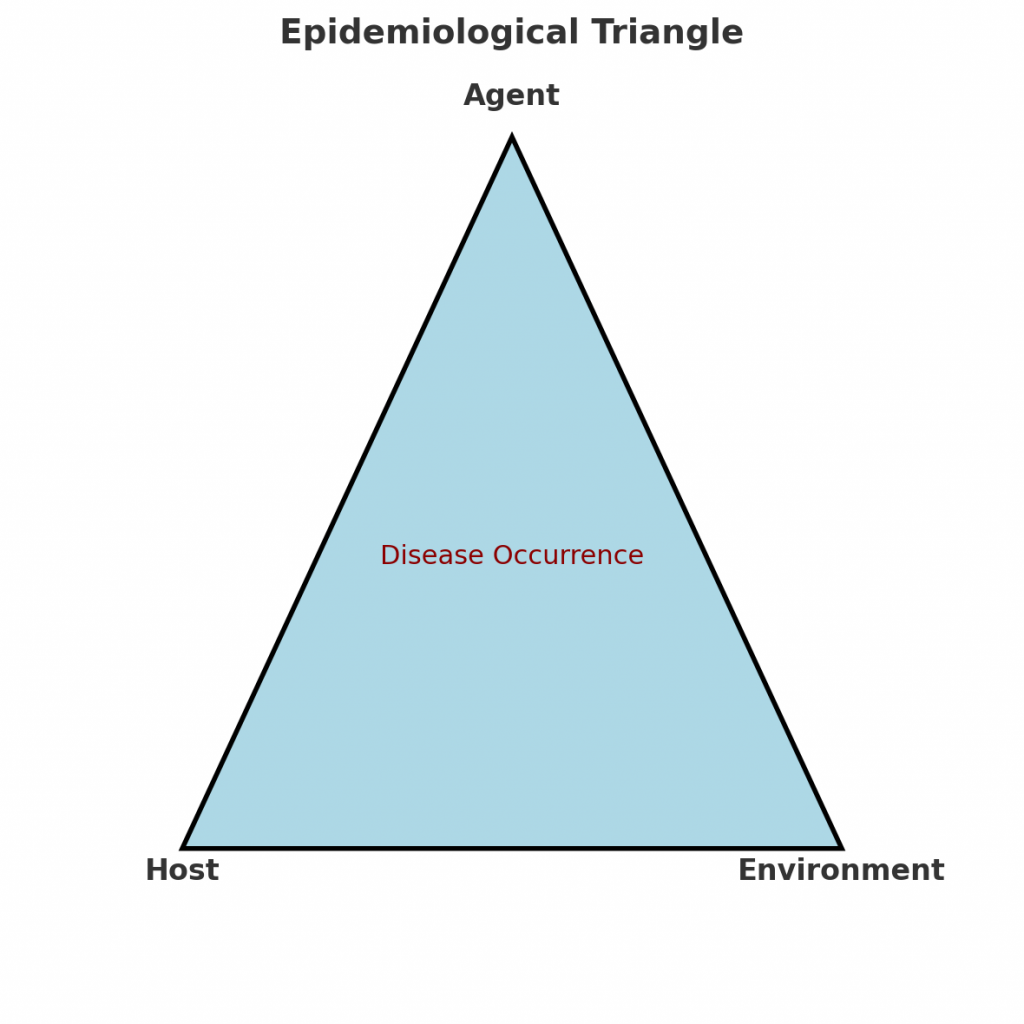
Used mainly for infectious diseases
| Components | Explanation |
|---|---|
| Agent | The cause of disease (e.g., bacteria, virus, toxin) |
| Host | The person or organism that gets affected (e.g., age, immunity, genetics) |
| Environment | External factors that allow disease transmission (e.g., climate, sanitation, crowding) |
🔁 Disease occurs when the agent, host, and environment interact under favorable conditions.
🦠 Example: Malaria
- Agent: Plasmodium parasite
- Host: Human (especially with weak immunity)
- Environment: Stagnant water for mosquito breeding
2️⃣ Wheel Model of Causation
Best suited for chronic diseases and genetic-environment interactions
- Shows disease as a result of the interaction between genetic core (host) and the environmental factors
- Environment is divided into:
- Biological (bacteria, allergens)
- Physical (radiation, pollution)
- Social (culture, economic status)
🌀 Example: Hypertension
- Genetic predisposition (core)
- Sedentary lifestyle, stress, diet (environment)
3️⃣ Web of Causation
Used for multifactorial and lifestyle diseases
- Disease is caused by many interrelated factors, not a single cause
- Factors can be direct or indirect, and they interact with each other in a complex web
🕸️ Example: Coronary Heart Disease
- Smoking, high cholesterol, hypertension, stress, family history, obesity, etc.
📌 Importance: Helps plan multi-level prevention strategies (lifestyle change, environment, screening)
4️⃣ BEINGS Model (Modern Holistic Model)
Developed for non-communicable diseases
B – Biological & Behavioral
E – Environmental
I – Immunological
N – Nutritional
G – Genetic
S – Social and Spiritual
✔️ Useful in community health nursing for assessing all possible dimensions of a disease cause.
🔍 Comparison of Models
| Model | Best For | Main Feature |
|---|---|---|
| Epidemiological Triad | Infectious diseases | Agent-Host-Environment interaction |
| Wheel Model | Chronic/Genetic diseases | Host (genetic core) + environmental exposure |
| Web of Causation | Multifactorial diseases | Multiple interlinked causes |
| BEINGS Model | Holistic disease approach | Includes behavior, society, nutrition |
🧾
Understanding the epidemiological models of causation allows nurses and public health professionals to:
- Identify the origin of diseases
- Understand risk factors
- Design effective prevention and health promotion strategies
These models are foundations of epidemiology, helping shift focus from treating illness to preventing disease.
🦠 Concepts of Disease Transmission
How Infectious Diseases Spread from One Host to Another
✅ 1. What is Disease Transmission?
Disease transmission refers to the process by which an infectious agent (pathogen) is spread from a source (infected person, animal, or object) to a susceptible host.
Understanding transmission is essential to prevent and control infections in the community, healthcare settings, and during outbreaks.
🔄 2. Chain of Infection (The 6 Links)

Disease is transmitted through a “chain of infection” that includes:
| Link | Explanation |
|---|---|
| 1️⃣ Infectious Agent | The microorganism that causes disease (e.g., bacteria, virus, parasite) |
| 2️⃣ Reservoir | Where the agent lives and multiplies (e.g., humans, animals, water) |
| 3️⃣ Portal of Exit | How the agent leaves the reservoir (e.g., sneezing, blood, urine, feces) |
| 4️⃣ Mode of Transmission | How it spreads to another person (see below 👇) |
| 5️⃣ Portal of Entry | How it enters a new host (e.g., mouth, nose, skin breaks, genital tract) |
| 6️⃣ Susceptible Host | A person who can get the disease (weakened immunity, unvaccinated, etc.) |
🛑 Breaking any link in the chain can help prevent the spread of disease!
🔁 3. Modes of Disease Transmission
A. Direct Transmission
The infectious agent is transferred immediately and directly from one person to another.
| Type | Examples |
|---|---|
| Direct Contact | Touching, kissing, sexual contact (e.g., STIs, herpes, scabies) |
| Droplet Spread | Coughing, sneezing (e.g., COVID-19, influenza, tuberculosis) |
| Vertical Transmission | Mother to baby during pregnancy or birth (e.g., HIV, syphilis) |
B. Indirect Transmission
The agent is transferred through an intermediate object or organism.
| Type | Examples |
|---|---|
| Airborne | Tiny droplets remain in air (e.g., measles, TB) |
| Fomite-Borne | Contact with contaminated objects (e.g., door handles, bed linens) |
| Vehicle-Borne (Food/Water) | Contaminated food or drink (e.g., cholera, typhoid, hepatitis A) |
| Vector-Borne | Via insects like mosquitoes or fleas (e.g., malaria, dengue, plague) |
| Iatrogenic | Due to medical/surgical procedures (e.g., via needles, instruments) |
🧪 4. Types of Carriers (Source of Infection)
| Carrier Type | Description |
|---|---|
| Healthy Carrier | No symptoms but can transmit (e.g., typhoid carrier) |
| Incubatory Carrier | Can transmit before symptoms appear (e.g., hepatitis B) |
| Convalescent Carrier | Transmits after recovery (e.g., diphtheria) |
| Chronic Carrier | Carries agent for a long time (e.g., HIV, HBV) |
🕰️ 5. Periods Related to Infection
| Term | Meaning |
|---|---|
| Incubation Period | Time between exposure and first symptoms |
| Prodromal Period | Early mild symptoms before major illness |
| Communicable Period | Time when a person can spread the infection |
| Recovery Period | Time when person starts to get better |
🛡️ 6. Breaking the Chain of Transmission
| Action | Breaks Which Link? |
|---|---|
| Hand washing, PPE | Breaks mode of transmission |
| Immunization | Makes host less susceptible |
| Safe sex, sterilization, masks | Prevents entry/exit of pathogen |
| Vector control, sanitation | Removes source and reservoir |
| Isolation, quarantine | Stops spread from infected to healthy person |
📌 7. Practical Examples of Transmission
| Disease | Mode of Transmission |
|---|---|
| Malaria | Indirect – vector-borne (mosquito) |
| Tuberculosis | Direct – droplet + indirect – airborne |
| Hepatitis A | Indirect – food and water contamination |
| COVID-19 | Direct (droplets) + indirect (surfaces) |
| HIV/AIDS | Direct – sexual, blood, vertical transmission |
🧾
Understanding the concepts of disease transmission is key to infection prevention and control. By knowing how diseases spread, nurses, health workers, and community members can take timely and appropriate measures to protect themselves and others—especially during outbreaks or epidemics.
🦠✨ How Diseases Travel: Understanding the Modes of Transmission & Chain of Infection
Imagine you’re a detective, not solving a crime—but tracking a disease. To stop it in its tracks, you need to know how it spreads, where it hides, and how it finds its next victim. This is exactly what we do in epidemiology and infection control.
Let’s take a deep dive into the journey of an infectious disease, and how we, as healthcare providers, can break the chain and protect lives.
🔗 The Chain of Infection: 6 Crucial Links
Every infection follows a path—like links in a chain. Break even one link, and the chain collapses. Let’s explore each link:
1️⃣ Infectious Agent
The journey begins with the villain—a microbe like a virus, bacteria, or parasite (think: COVID-19 virus, TB bacteria, malaria parasite).
2️⃣ Reservoir
Next, the microbe needs a home to live and multiply. This could be the human body, an animal, soil, or even water.
3️⃣ Portal of Exit
How does the microbe escape its host? Through sneezing, coughing, bleeding, urine, feces—or wounds.
4️⃣ Mode of Transmission
This is how the microbe travels from one place to another. It could jump through a handshake, fly in the air, hide on a doorknob, or catch a ride on a mosquito’s wings. (We’ll explore these in detail next!)
5️⃣ Portal of Entry
To infect someone new, the microbe needs a doorway—like the mouth, nose, broken skin, or genitals.
6️⃣ Susceptible Host
Finally, it needs someone vulnerable—like an unvaccinated child, an elderly person, or someone with low immunity.
🌟 Your mission as a nurse or health worker? Break this chain!
🚪 The Routes of Infection: Modes of Transmission
Let’s now follow the pathogens’ favorite routes—how they move from one host to another.
🔴 A. Direct Transmission: Face to Face
This is up close and personal. The microbe travels straight from one person to another, with no stop in between.
- Direct contact – Like a hug, handshake, kiss, or sexual contact. (STIs, herpes, scabies)
- Droplet spread – A cough or sneeze sends droplets flying. (COVID-19, flu, TB)
- Mother to child – Passed during pregnancy, birth, or breastfeeding. (HIV, syphilis)
🛡️ Protect yourself with: hand hygiene, masks, gloves, safe sex practices.
🔵 B. Indirect Transmission: The Sneaky Way
Here, the pathogen uses a middleman to get to its next host.
- Airborne – The microbe floats in the air on dust or droplets. (Measles, TB)
- Fomites (contaminated objects) – Like used syringes, dirty linens, or door handles.
- Vehicle-borne – Contaminated food, water, blood, or medicines. (Typhoid, hepatitis A)
- Vector-borne – Mosquitoes, flies, or ticks carry and deliver the disease. (Malaria, dengue)
- Iatrogenic – From improper medical procedures. (Unsafe injections, surgeries)
🛡️ Break the spread with: disinfection, safe water, insect control, sterilization.
🧠 A Quick Recap: Direct vs Indirect
| Direct Transmission | Indirect Transmission |
|---|---|
| Person-to-person | Via air, object, food, insect, or tools |
| Fast and personal | Often involves a “middleman” |
| Example: Flu from a sneeze | Example: Cholera from dirty water |
👩⚕️ How Can You Break the Chain?
As a health worker, you hold the power to stop infections from spreading. Here’s how:
| Link in the Chain | What You Can Do |
|---|---|
| Infectious Agent | Use disinfectants, antibiotics, sterilization |
| Reservoir | Isolate sick individuals, manage chronic carriers |
| Portal of Exit | Use masks, condoms, and wound care |
| Mode of Transmission | Handwashing, PPE, clean environment |
| Portal of Entry | Use gloves, bandages, repellents |
| Susceptible Host | Promote vaccination, nutrition, hygiene |
🧾
Diseases don’t appear out of nowhere—they follow a path, moving from one person to the next. But if we understand that path, we can block it. Whether you’re giving vaccines, washing hands, educating families, or setting up infection control protocols—you’re actively breaking the chain of infection.
🛡️ Your actions can save lives.
📈⏳ Time Trends in Disease Occurrence
Understanding How Disease Patterns Change Over Time
✅ **What Are Time Trends in Epidemiology?
Time trends (also called time fluctuations) refer to the variations in disease occurrence over time—days, weeks, months, or years. These patterns help detect outbreaks, understand disease behavior, and plan effective public health interventions.
Studying time trends tells us when, how often, and how long diseases occur.
🔍 Types of Time Trends or Fluctuations
1️⃣ Short-Term Fluctuations (Epidemics)
These are sudden rises in disease cases over a short time, usually days or weeks.
- Often due to outbreaks or exposure to a source.
- Examples:
- Food poisoning at a wedding 🥘
- Dengue outbreak after monsoon 🦟
- COVID-19 spike during festival travel 🦠
Epidemic curve (epi curve) helps visualize the pattern of rise and fall.
2️⃣ Periodic Fluctuations (Seasonal/Recurring Trends)
These occur at regular intervals (seasonal or cyclical).
🔄 A. Seasonal Variation
- Disease rates rise and fall depending on climate or season.
- Examples:
- Influenza: Winter ❄️
- Diarrhea: Summer ☀️
- Malaria: Monsoon 🌧️
🔁 B. Cyclic Trends
- Occur in multi-year cycles due to immunity, vaccination, or environmental changes.
- Example: Measles outbreaks every 3–4 years in unvaccinated communities.
3️⃣ Long-Term Fluctuations (Secular Trends)
These are gradual changes in disease rates over years or decades.
- Help monitor chronic diseases and national programs.
- Examples:
- 📉 Decrease in polio cases (due to vaccination)
- 📈 Increase in diabetes and obesity (lifestyle changes)
- 📉 Decline in maternal mortality over decades (health system improvement)
These trends often guide health policies and long-term resource planning.
4️⃣ Random Fluctuations
- Unpredictable and not related to season or outbreak.
- Caused by chance, reporting errors, or small population size.
- Example: 2 cases of rare cancer in a small village without known cause.
📘 How Time Trends Help in Public Health
| Use of Time Trends | How It Helps |
|---|---|
| Detect Outbreaks Early | Quick rise in cases signals epidemic |
| Allocate Resources | Plan staffing, beds, vaccines (e.g., during flu season) |
| Monitor Effectiveness of Programs | Check decline/increase after interventions |
| Predict Future Trends | Anticipate waves or peaks in disease |
| Educate and Alert Communities | Inform people during high-risk times (e.g., dengue season) |
📊 Visual Tools Used in Time Trend Analysis
- Epidemic Curves – Short-term outbreaks
- Line Graphs – Long-term (secular) trends
- Seasonal Charts – Compare month-to-month disease patterns
- Bar Graphs or Histograms – Weekly or monthly fluctuations
🧾
Time trends in disease occurrence provide a powerful tool for nurses, public health officials, and policy-makers. By understanding how diseases behave over time, we can predict outbreaks, prepare healthcare systems, and protect communities.
🔍 Epidemiological Approaches: Descriptive Study
Laying the Foundation for Understanding Disease Patterns
✅ What is a Descriptive Study in Epidemiology?
A Descriptive study is the first step in epidemiological investigation. It answers the fundamental questions:
Who? Where? When?
It helps describe what is happening in a population related to a disease or health event, but does not establish cause.
Think of it like a health snapshot: It shows the distribution of disease, not the reasons behind it.
🎯 Objectives of Descriptive Study
- To describe the distribution of disease or health events in a population
- To detect patterns based on person, place, and time
- To generate hypotheses (ideas) for further analytical study
- To identify at-risk groups and plan interventions
📌 Key Elements of Descriptive Study
1️⃣ Person – Who is affected?
- Age
- Sex
- Occupation
- Marital status
- Ethnicity
- Socioeconomic status
- Behaviors (smoking, alcohol use, etc.)
📍 Example: TB more common in malnourished, low-income males aged 25–40.
2️⃣ Place – Where is the disease occurring?
- Geographic location (urban/rural)
- Regions, countries, districts
- Specific settings (homes, schools, hospitals)
📍 Example: Dengue outbreak concentrated in low-lying, waterlogged urban areas.
3️⃣ Time – When is the disease occurring?
- Seasonality
- Time trends (increasing/decreasing)
- Short-term outbreaks (epidemics)
📍 Example: Influenza peaks during winter months every year.
🗂️ Types of Descriptive Studies
| Type | Description | Example |
|---|---|---|
| Case Report | Detailed report of a single case of a rare disease | One case of new strain of avian flu |
| Case Series | Description of multiple similar cases | 10 patients with dengue in a single ward |
| Cross-sectional Study (Prevalence Study) | Data collected at a single point in time | Survey on prevalence of anemia in pregnant women |
📊 Data Collection Methods in Descriptive Studies
- Surveys and questionnaires
- Hospital or clinic records
- Health management information systems (HMIS)
- Community-based screenings
🔍 How Descriptive Studies Are Used in Nursing/Public Health
| Purpose | Example |
|---|---|
| Identify disease burden | % of underweight children in a district |
| Track epidemics | Sudden rise in food poisoning cases |
| Monitor program impact | Compare anemia rates before and after iron supplementation |
| Plan services | Where to open a new TB treatment center |
⚠️ Limitations of Descriptive Studies
- Do not explain cause-effect
- Cannot confirm if exposure leads to disease
- Only useful for generating hypotheses, not testing them
🧾
Descriptive studies form the foundation of epidemiology. They help health professionals understand patterns, identify risk groups, and plan targeted interventions. Though they don’t prove causation, they are essential for early detection and prevention in community health.
📊 Epidemiological Approaches: Analytical Study
Finding the “Why” Behind the Disease
✅ What is an Analytical Study in Epidemiology?
An Analytical Study is used to investigate the cause (etiology) of disease by comparing groups with and without the disease. It answers the questions:
Why? and How? the disease occurred.
Unlike descriptive studies (which show what is happening), analytical studies explore why it is happening.
🎯 Objectives of Analytical Studies
- To identify risk factors or causes of diseases
- To test hypotheses developed from descriptive studies
- To establish a relationship between exposure and outcome
- To help plan prevention and control measures
🔍 Basic Structure of an Analytical Study
Analytical studies compare two or more groups:
| Group A | Group B |
|---|---|
| Exposed to risk factor | Not exposed to risk factor |
| OR | |
| Has the disease | Does not have the disease |
📂 Types of Analytical Studies
1️⃣ Cohort Study (Prospective Study)
Starts with exposure and watches forward for outcome.
- Selects people based on exposure status
- Follows them over time to see who develops the disease
- Measures incidence rate and relative risk (RR)
📝 Example:
Follow two groups of smokers and non-smokers → compare how many develop lung cancer over 10 years.
2️⃣ Case-Control Study (Retrospective Study)
Starts with disease and looks back for exposure.
- Selects people based on disease status (cases and controls)
- Compares past exposure between both groups
- Measures odds ratio (OR)
📝 Example:
Study people with TB (cases) and without TB (controls) → compare their history of malnutrition or crowded living.
3️⃣ Cross-Sectional Analytical Study
Exposure and disease data collected at the same time.
- Often used in surveys or field studies
- Cannot establish time sequence but useful for quick analysis
- Measures prevalence and associations
📝 Example:
Survey school children for both worm infestation and anemia at the same time.
🧠 Key Differences: Cohort vs Case-Control
| Aspect | Cohort Study | Case-Control Study |
|---|---|---|
| Starts with | Exposure | Disease |
| Time direction | Prospective (forward) | Retrospective (backward) |
| Sample size | Usually large | Can be small |
| Cost & time | More expensive and time-consuming | Faster and cheaper |
| Risk measurement | Relative Risk (RR) | Odds Ratio (OR) |
📘 Use of Analytical Studies in Public Health/Nursing
| Application | Example |
|---|---|
| Identify causes of outbreaks | Water contamination during typhoid outbreak |
| Study occupational hazards | Link between pesticide exposure and cancer in farmers |
| Evaluate risk factors | Relationship between poor nutrition and TB |
| Guide prevention programs | Evidence for banning tobacco or launching anti-smoking drives |
⚠️ Limitations of Analytical Studies
- Cohort studies take time and are costly
- Case-control studies can suffer from recall bias
- Difficult to control for confounding variables
- Cannot always prove 100% causation
🧾
Analytical studies help answer the why and how of disease occurrence. They are essential for identifying causes, testing risk factors, and guiding public health action. For nurses and health professionals, they provide the scientific evidence to design effective prevention and intervention programs.
🧪 Epidemiological Approaches: Experimental Study
Testing What Works Through Scientific Trials
✅ What is an Experimental Study in Epidemiology?
An experimental study (also called an intervention study) is a planned, controlled study where the researcher actively introduces an intervention (e.g., drug, vaccine, health program) and observes its effect on health outcomes.
It’s the only epidemiological approach that allows us to say:
“This intervention caused this result.”
🎯 Objectives of Experimental Studies
- To test the effectiveness of a new treatment, vaccine, or health service
- To compare two or more interventions
- To provide scientific evidence for health policy and protocols
- To assess safety, cost-effectiveness, and outcomes
🧪 Key Features of an Experimental Study
- Researcher controls the exposure/intervention
- Participants are divided into groups (experimental vs control)
- Followed over time to measure outcomes
- Data analyzed to see if the intervention made a difference
📂 Types of Experimental Studies
1️⃣ Randomized Controlled Trial (RCT) – Gold Standard
- Participants are randomly assigned to:
- Intervention group – receives treatment
- Control group – receives placebo or standard care
- Minimizes bias and confounding factors
- Common in drug trials, vaccine efficacy studies
📝 Example:
New vaccine trial – 1,000 people divided into two groups → one gets vaccine, other gets placebo → compare infection rates.
2️⃣ Field Trial
- Conducted in healthy people at risk of developing disease
- Measures preventive effectiveness of vaccine or intervention
📝 Example:
Oral polio vaccine tested in children to prevent polio in a community.
3️⃣ Community Trial (Community Intervention Study)
- Whole communities or groups receive the intervention, not individuals
- Used for health education, sanitation, nutrition programs
📝 Example:
One village receives a handwashing campaign; another does not → compare diarrhea rates.
🔍 Steps in Conducting an Experimental Study
- Define the objective and target population
- Select participants (inclusion and exclusion criteria)
- Randomly assign to intervention or control group
- Apply the intervention (drug, program, vaccine)
- Follow up and observe health outcomes
- Analyze and interpret data
- Draw conclusions about effectiveness or harm
⚖️ Ethical Considerations
- Informed consent from all participants
- Ensure safety, confidentiality, and right to withdraw
- Must be approved by Ethical Review Board
- Do no harm—risk should never outweigh benefits
📊 Applications in Public Health and Nursing
| Use | Example |
|---|---|
| Vaccine effectiveness | COVID-19 vaccine trials |
| Drug trials | New TB drug testing |
| Behavior intervention programs | Handwashing promotion to prevent infections |
| Screening strategy evaluation | Comparing VIA vs Pap smear in cervical cancer screening |
⚠️ Limitations of Experimental Studies
- Can be expensive and time-consuming
- Ethical constraints (can’t deny treatment to control group)
- May not reflect real-world settings (lack of generalizability)
- Loss to follow-up may affect results
🧾
Experimental studies are the most powerful tools in epidemiology to test cause-effect relationships. They help develop evidence-based interventions, drugs, and health policies. For nurses and public health workers, understanding experimental designs supports quality patient care and community health planning.
🛡️ Principles of Disease Control Measures & Levels of Prevention
Protecting Health, Preventing Disease, and Promoting Well-being
✅ What is Disease Prevention and Control?
Disease prevention and control involves planned efforts to reduce the occurrence, impact, or spread of disease in individuals or populations.
- Prevention = Stopping disease before it starts (or worsens)
- Control = Reducing the severity or spread of existing diseases
⚖️ Principles of Disease Control Measures
Effective control measures follow these core principles:
| Principle | Explanation |
|---|---|
| Early Detection | Identify diseases early (e.g., screening for hypertension) |
| Breaking the Chain of Transmission | Stop the spread (e.g., handwashing, masks, isolation) |
| Protect the Susceptible | Vaccination, supplements, immunity building |
| Environmental Control | Improve sanitation, clean water, waste management |
| Health Education & Behavior Change | Promote safe practices and healthy lifestyle |
| Prompt Treatment | Cure the infected to reduce reservoir and transmission |
| Monitoring and Surveillance | Track cases, analyze trends, plan response |
| Community Participation | Involve people in their own health improvement |
⛑️ Levels of Prevention of Disease
The levels of prevention describe when and how interventions occur during the disease timeline. There are four levels:
1️⃣ Primordial Prevention – Before risk factors develop
| 🔹 Goal: Prevent the emergence of unhealthy lifestyles or environmental risks
| 🔹 Target: Entire population or high-risk groups
| 🔹 Examples:
- Anti-smoking policies
- Promoting physical activity in schools
- Laws to reduce air pollution
- Health awareness in children
2️⃣ Primary Prevention – Before disease starts
| 🔹 Goal: Prevent the onset of disease
| 🔹 Target: Healthy individuals with risk factors
| 🔹 Examples:
- Immunization (e.g., measles, polio)
- Iron and folic acid for pregnant women
- Safe water and sanitation
- Use of insecticide-treated bed nets
3️⃣ Secondary Prevention – Early disease detection & treatment
| 🔹 Goal: Detect and treat disease early to prevent complications
| 🔹 Target: Individuals with early, undiagnosed disease
| 🔹 Examples:
- Screening for cancer, hypertension, diabetes
- Pap smear, VIA tests for cervical cancer
- Early treatment of TB, STIs
- Contact tracing in outbreaks
4️⃣ Tertiary Prevention – Limit disability and promote recovery
| 🔹 Goal: Reduce impact, prevent disability, and restore function
| 🔹 Target: People already affected by disease
| 🔹 Examples:
- Physiotherapy for stroke survivors
- Dialysis for kidney failure
- Rehabilitation for polio or injuries
- Support groups for mental illness
🧠 Quick Recap Table
| Level | Focus | Example |
|---|---|---|
| Primordial | Prevent risk factor | Health education in schools |
| Primary | Prevent disease onset | Vaccination, vector control |
| Secondary | Early detection & treatment | Cancer screening, BP checks |
| Tertiary | Limit disability | Rehab, support care, assistive devices |
🧾
Understanding the principles of disease control and the levels of prevention helps nurses and health workers take the right action at the right time—whether it’s educating the public, vaccinating children, screening for illness, or caring for the chronically ill. Together, these strategies are key to improving health outcomes and preventing suffering in individuals and communities.
🦠🕵️♀️ Investigation of an Epidemic of Communicable Disease
How Health Teams Detect, Control, and Prevent Outbreaks
✅ What is an Epidemic?
An epidemic is the sudden increase in cases of a disease beyond what is normally expected in a community, area, or season.
Example: Sudden rise in dengue cases in a village after heavy rains.
🎯 Objectives of Epidemic Investigation
- Confirm whether an epidemic is occurring
- Identify the source and mode of transmission
- Control and prevent further spread
- Provide appropriate treatment and health education
- Document the outbreak for future prevention
📊 Steps in Investigating an Epidemic (Standard 10 Steps)
1️⃣ Prepare for Field Work
- Get permission and form a health team (doctor, nurse, lab technician, etc.)
- Gather equipment: reporting formats, PPE, medicines, sampling kits
2️⃣ Establish the Existence of an Epidemic
- Compare current number of cases with usual (baseline) levels
- Use surveillance data, hospital records, or community reports
📝 Example: Normally 2 typhoid cases/month; now 15 cases in 1 week → possible outbreak.
3️⃣ Confirm the Diagnosis
- Review clinical symptoms, laboratory tests, and medical history
- Collect samples (blood, stool, sputum, etc.) for lab confirmation
- Rule out similar diseases (differential diagnosis)
4️⃣ Define and Identify Cases
- Create a case definition (based on symptoms, time, location) e.g., “Any person with fever, abdominal pain, and positive Widal test in Village X between 1st–15th March”
- Line list all cases with:
Name, age, sex, address, symptoms, date of onset, lab test, outcome
📋 Use a line listing format for data collection.
5️⃣ Describe the Epidemic (Time, Place, Person)
- Time: Create an epidemic curve to show the trend
- Place: Mark affected households or villages on a map
- Person: Analyze age, sex, occupation, travel, vaccination status
🎯 Helps identify who is most at risk, how it spreads, and when it started.
6️⃣ Develop Hypotheses
- Based on patterns, suggest possible cause and mode of transmission
🧠 Example hypotheses:
- Contaminated water source (typhoid)
- Mosquito breeding after rains (dengue)
- Contact at religious gathering (COVID-19)
7️⃣ Evaluate the Hypotheses
- Conduct surveys or interviews with cases and controls
- Compare exposures, food eaten, places visited, etc.
- Perform laboratory tests and environmental sampling
📈 Use statistics to test if your hypothesis holds true.
8️⃣ Refine Hypotheses and Re-Test (if needed)
- If initial hypothesis doesn’t match evidence, re-analyze
- Collect more data or adjust case definitions
9️⃣ Implement Immediate Control Measures
🛡️ Do not wait for full investigation—start control as early as possible:
| Disease | Immediate Actions |
|---|---|
| Diarrhea outbreak | Provide ORS, chlorinate water, promote handwashing |
| Malaria/dengue | Mosquito fogging, bed nets, eliminate stagnant water |
| Measles | Isolate cases, mass vaccination campaign |
✅ Educate the public, treat patients, control the source, and block transmission.
🔟 Communicate Findings & Follow-Up
- Prepare a report for health authorities and stakeholders
- Include cause, number of cases, control actions taken, and recommendations
- Plan monitoring and surveillance to prevent future outbreaks
📢 Share findings with the community in simple language.
🧾 Sample Tools Used in Epidemic Investigation
- Line Listing Format
- Spot map
- Epidemic curve
- Daily reporting forms
- Interview/questionnaire tools
- Water/food sample collection kits
👩⚕️ Role of Nurses and CHOs in Epidemic Investigation
- Early detection of cases during home visits
- Collecting data and reporting to MO/PHC
- Administering treatment and health education
- Sample collection (blood, stool, swab)
- Supporting outbreak control activities (chlorination, fogging)
- Counseling families and reducing panic
🧠 Real-Life Example: Cholera Outbreak
📍 In a village after flooding, many people reported diarrhea.
🔎 A nurse noticed a cluster of cases during VHND.
💧 On investigation: contaminated hand pump was the source.
🚰 Response: water purification, ORS distribution, hygiene education.
✅ Result: Cases dropped, and community was protected.
🧾
Epidemic investigation is like solving a public health mystery. Nurses and health workers play a crucial frontline role in detecting, investigating, and controlling outbreaks—protecting not just patients, but entire communities.
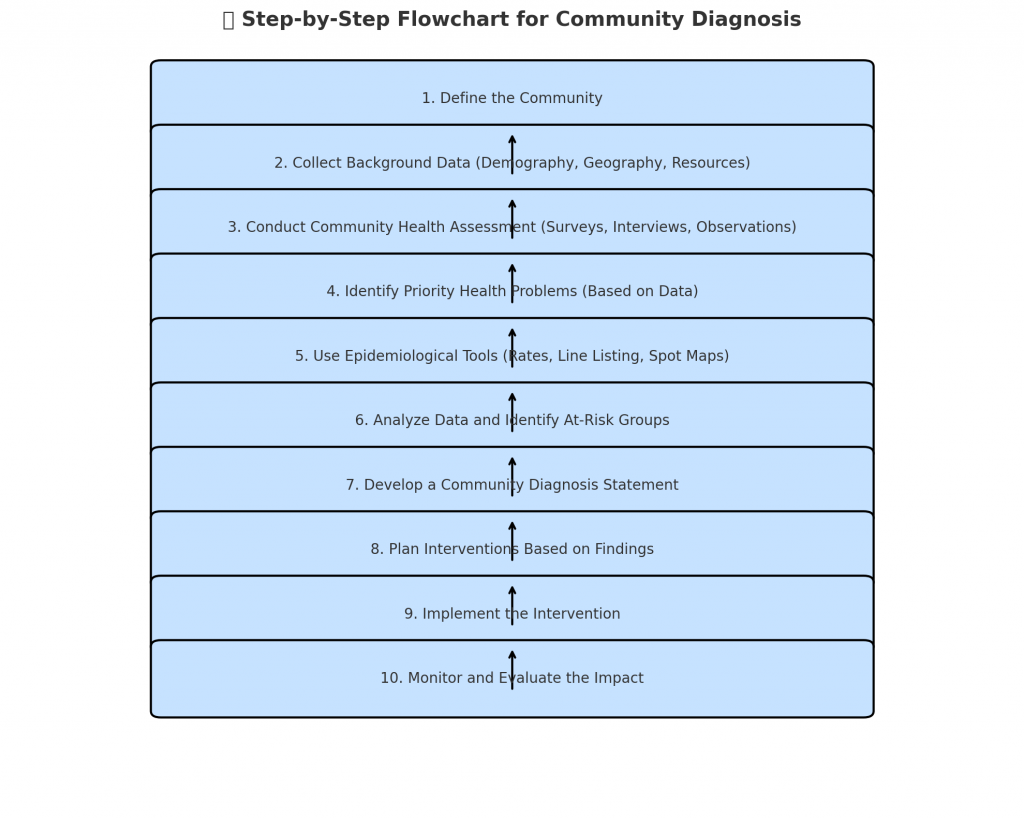
🧰📊 Using Basic Epidemiological Tools for Community Diagnosis
From Data to Action: Making Informed Health Plans for Communities
✅ What is a Community Diagnosis?
A community diagnosis is the systematic identification of health problems, risks, and needs of a population, using data and evidence. It is like taking a “health X-ray” of the community to understand:
- What are the major diseases or health issues?
- Who is affected and where?
- What are the causes and contributing factors?
It provides the foundation for planning interventions, allocating resources, and evaluating health programs.
🧪 Role of Epidemiology in Community Diagnosis
Epidemiology provides tools and methods to:
- Collect, analyze, and interpret health data
- Measure disease frequency and patterns
- Identify at-risk populations and priority health problems
- Guide prevention, promotion, and control strategies
🛠️ Basic Epidemiological Tools Used
1️⃣ Epidemiological Rates and Ratios
| Measure | Use in Community Diagnosis |
|---|---|
| Incidence Rate | Detect new cases (e.g., new TB cases in a year) |
| Prevalence Rate | Know the total burden of disease (e.g., diabetes) |
| Mortality Rate | Assess deaths due to specific diseases |
| Infant/Maternal Mortality Rate | Evaluate maternal-child health programs |
2️⃣ Surveys and Screening
- Health surveys (e.g., anemia, NCD risk factors)
- Rapid assessments during outbreaks or disasters
- Screening camps for hypertension, diabetes, cancer
📝 Example: Mass screening for anemia among adolescent girls reveals 65% prevalence → leads to iron supplementation program.
3️⃣ Line Listing of Cases
A table recording details of each case:
- Name, age, sex, village, symptoms, date of onset
- Useful in epidemic investigation, spotting clusters, and planning response
4️⃣ Epidemic Curve
- Visual representation of number of cases over time
- Helps identify pattern, peak, and source of outbreak
📈 Example: A sudden peak in diarrhea cases → foodborne or waterborne outbreak suspected.
5️⃣ Spot Maps / GIS Mapping
- Shows geographic location of cases
- Identifies hotspots or clusters for targeted intervention
🗺️ Example: Marking malaria cases by hamlet to plan fogging or bed net distribution.
6️⃣ Community Profiling Tools
- Social mapping: shows community layout, resources, vulnerable areas
- Transect walks: observe environmental factors (open drains, water sources)
- Focus group discussions: understand health behaviors, beliefs, and barriers
📘 How These Tools Help in Health Planning
| Function | How Epidemiological Tools Support |
|---|---|
| Identify health priorities | Highest prevalence/incidence shows urgent problems |
| Target specific groups | Age-wise, area-wise data helps customize interventions |
| Plan appropriate interventions | Choose correct methods (immunization, health education, etc.) |
| Allocate resources wisely | Send more staff/medicines to high-burden areas |
| Monitor and evaluate outcomes | Use before-after data to see program effectiveness |
👩⚕️ Example: Community Diagnosis Using Epidemiological Tools
📍 In a tribal village:
- Survey reveals 80% children are underweight
- GIS map shows water source near cattle area
- Line list shows repeated diarrhea cases in children
- Screening reveals 40% anemia in pregnant women
🔍 Action Plan:
- Nutrition program for children
- Iron-folic acid for pregnant women
- Water source shifted and chlorinated
- Health education on hygiene and feeding
📊 Key Epidemiological Tools at a Glance
| Tool | Purpose |
|---|---|
| Incidence & prevalence | Measure disease burden |
| Line listing | Case tracking during outbreaks |
| Surveys | Assess health status and risk factors |
| Spot map | Identify affected areas for quick action |
| Epi curve | Understand disease trend over time |
| Focus group discussions | Learn community perceptions and practices |
🧾
Using basic epidemiological tools allows nurses, CHOs, and public health workers to transform data into meaningful action. A strong community diagnosis helps plan evidence-based, targeted, and effective health interventions—saving time, money, and most importantly, lives.